
MACSI(Military Archive Country Strength Index)
ⓘ The ten scoring axes are weighted per country by coastal, nuclear, industrial, and geostrategic tier, then judged from real-world knowledge rather than stored database attributes — see methodology.
01 / Overview
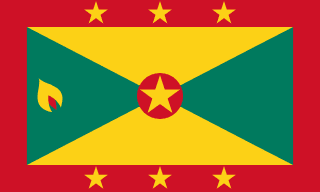
Grenada
Government
Parliamentary
Population
126.3K
Area
344 km²
GDP (Nominal)
$1.2B
Active Personnel
150
Defense Budget
$15M · %2 GDP
Conscription
None
42 years 10 months 28 days
TIME WITHOUT CONFLICT
02 / Military Strength · 76 metrics · 9 categories
1
MACSIMilitary Archive Country Strength Index
| # | Country | Overall | Land | Air | Naval | Leadership | Strategic | Industry | C4ISR | Logistics | Economy |
|---|---|---|---|---|---|---|---|---|---|---|---|
| #184 |  Vanuatu | 1 | 1 | 0 | 1 | 2 | 0 | 0 | 0 | 1 | 1 |
| #185 |  Saint Kitts and Nevis | 1 | 1 | 0 | 2 | 3 | 0 | 0 | 1 | 1 | 2 |
| #186 |  Grenada | 1 | 1 | 0 | 2 | 3 | 0 | 0 | 1 | 1 | 2 |
| #187 |  Monaco | 1 | 1 | 0 | 1 | 2 | 0 | 0 | 2 | 1 | 3 |
| #188 |  Vatican City | 1 | 1 | 0 | 0 | 1 | 0 | 0 | 1 | 0 | 0 |
Comparison countries are selected automatically based on global rankings.
Personnel Structure
Total Population: 126K
Active150
Reserve0
Paramilitary0
Economic Burden
$15M 2% of GDP
0% 5%+
Per Capita $119/yr
Per Soldier $100,000/yr
Strategic Infrastructure
Military Airports 0
Total Airports 3
Major Ports 1
Coastline 121 km
Oil Production 0 bbl/day
All Military Metrics 76 metrics · 9 categories
01 Personnel 8
- Active Personnel 150
- Reserve Personnel 0
- Paramilitary Personnel 0
- Total Military Personnel 150
- Available for Military Service 60,000
- Reaching Military Age Annually 3,000
- Conscription Status None
- Conscription Duration (days) 0 day
02 Land Forces 12
- Total Tanks 0
- IFV Count 0
- APC Count 0
- Recon Vehicle Count 0
- MRAP Count 0
- Towed Artillery Count 0
- Self-Propelled Artillery Count 0
- MLRS Count 0
- Mortar Count 0
- ATGM Launcher Count 0
- SHORAD Count 0
- MANPADS Count 0
03 Air Forces 12
- Total Aircraft 0
- Fighter Aircraft Count 0
- Ground Attack Aircraft Count 0
- Bomber Aircraft Count 0
- Transport Aircraft Count 0
- Tanker Aircraft Count 0
- AWACS Count 0
- Trainer Aircraft Count 0
- Total Helicopters 0
- Attack Helicopter Count 0
- Transport Helicopter Count 0
- UAV Count 0
04 Naval Forces 11
- Total Ships 0
- Aircraft Carrier Count 0
- Amphibious Assault Ship Count 0
- Cruiser Count 0
- Destroyer Count 0
- Frigate Count 0
- Corvette Count 0
- Total Submarines 0
- SSN Count 0
- SSBN Count 0
- Patrol Boat Count 0
05 Strategic Forces 9
- Nuclear Status None
- Nuclear Warhead Count 0
- Deployed Warhead Count 0
- ICBM Count 0
- SLBM Count 0
- IRBM Count 0
- Triad Status None
- BMD Capability ✗ No
- Space Assets ✗ No
06 Budget & Economy 10
- Defense Budget (USD) 15,000,000 USD
- Defense Budget (% of GDP) 2 %
- Defense Budget per Capita (USD) 119 USD
- GDP (Nominal, USD) 1,200,000,000 USD
- GDP (PPP, USD) 1,800,000,000 USD
- Arms Exports (USD) 0 USD
- Arms Imports (USD) 5,000,000 USD
- Defense Industry Rank 0
- Defense Industry Size (USD) 0 USD
- Defense Sector Employment 0
07 Logistics & Infrastructure 6
- Military Airport Count 0
- Total Airport Count 3
- Major Port Count 1
- Oil Production (bbl/day) 0 bbl/day
- Oil Reserves (bbl) 0 bbl
- Coastline (km) 121 km
08 Demographics 5
- Total Population 126,323
- Military Age Population 90,000
- Urban Population (%) 36 %
- Literacy Rate (%) 98 %
- Area (km²) 344 km²
09 Government & Alliances 3
- Government Type Parliamentary
- NATO Member ✗ No
- UN Security Council P5 ✗ No
03 / Inventory · 28 systems · 12 categories · 18 units
Force Composition
Not yet entered. This chart will populate automatically once inventory data is added.
Status & Age Distribution
Status
Active 22 Retired 6
Suppliers
Countries
-
 Russia 12
-
 Czech Republic 6
-
 United States 4
-
 Finland 2
-
 United Kingdom 2
-
 Germany 1
-
 North Korea 1
-
 Serbia 1
Inventory 28 systems · 5 categories · 18 units
⌕
ARMOURED VEHICLES
ARTILLERY & MISSILE SYSTEMS
AIR DEFENSE SYSTEMS
FIREARMS
CZ 52 —
Pistols · ACTIVE
Makarov PM —
Pistols · ACTIVE
Luger pistol —
Pistols · RETIRED
M3 submachine gun —
Machine Pistols · ACTIVE
PPS submachine gun —
Machine Pistols · ACTIVE
Sa 23 —
Machine Pistols · ACTIVE
Sten —
Machine Pistols · ACTIVE
M/28 —
Bolt-Action Rifles · RETIRED
M/39 —
Bolt-Action Rifles · RETIRED
Mosin–Nagant —
Bolt-Action Rifles · RETIRED
L1A1 Self-Loading Rifle —
Battle Rifles · RETIRED
AKM —
Assault Rifles · ACTIVE
+9 more
GRENADE LAUNCHERS & GRENADES
04 / Defense Sector · · 1 deals
DEFENSE TRADE BALANCE annual estimate · from DB
Defense Industry Size
$0
annual output value
Sector Employment
0
total employees
↗ EXPORTS
$0
↘ IMPORTS
$5 M
⚖ NET BALANCE
$-5 M
NET IMPORTER
In exports
In imports
Export per Capita $0.00 per citizen
Import per Capita $39.6 per citizen
RECENT DEFENSE DEALS0 export · 1 import
| Direction | Year | Counterparty | Product / Service | Quantity | Amount | Type | Status | |
|---|---|---|---|---|---|---|---|---|
| ↘ | —→1983 |  Cuba | Vz.53 Anti-Aircraft Gun | — | — | gift | Delivered |
No defense industry recorded for this country yet.
05 / History & Conflicts · 1 armed events
Fire Line Most active: Cold War
Alliance Network by past conflicts
🛡 Most Allied
Antigua and Barbuda 1 wars Barbados 1 wars Dominica 1 wars Jamaica 1 wars Saint Kitts and Nevis 1 wars ◄── Grenada ──►
Based on conflicts fought on the same or opposing side.
War Statistics Grenada · 1 conflicts
1Conflicts
1Wins
0Losses
0Draws
0Ongoing
Highest Own Losses 69 1983 Invasion of Grenada Highest Enemy Losses 24 1983 Invasion of Grenada Longest 2 months 1983 Invasion of Grenada
Human Cost · Grenada
45Military
0Civilian
0Displaced
Data as of 2026; figures may vary by source.
📜 Chronological Conflict List
| Conflict | Years | Opponent | Role | Outcome |
|---|---|---|---|---|
| 1983 Invasion of Grenada Intervention | 1983 | Intervention | Primary | Decisive Win |
06 / Geostrategy · comparative
A
VSB
GrenadavsVanuatu
01Personnel
Active Personnel
+%100
Reserve Personnel
=
Paramilitary Personnel
Total Military Personnel
Available for Military Service
Reaching Military Age Annually
Conscription Duration (days)
02Land Forces
Total Tanks
=
IFV Count
APC Count
Recon Vehicle Count
MRAP Count
Towed Artillery Count
Self-Propelled Artillery Count
MLRS Count
Mortar Count
ATGM Launcher Count
SHORAD Count
MANPADS Count
03Air Forces
Total Aircraft
=
Fighter Aircraft Count
Ground Attack Aircraft Count
Bomber Aircraft Count
Transport Aircraft Count
Tanker Aircraft Count
AWACS Count
Trainer Aircraft Count
Total Helicopters
Attack Helicopter Count
Transport Helicopter Count
UAV Count
04Naval Forces
Total Ships
+%100
Aircraft Carrier Count
Amphibious Assault Ship Count
Cruiser Count
Destroyer Count
Frigate Count
Corvette Count
Total Submarines
SSN Count
SSBN Count
Patrol Boat Count
05Strategic Forces
Nuclear Warhead Count
Deployed Warhead Count
ICBM Count
SLBM Count
IRBM Count
06Budget & Economy
Defense Budget (USD)
Defense Budget (% of GDP)
Defense Budget per Capita (USD)
GDP (Nominal, USD)
GDP (PPP, USD)
Arms Exports (USD)
Arms Imports (USD)
Defense Industry Rank
Defense Industry Size (USD)
Defense Sector Employment
07Logistics & Infrastructure
Military Airport Count
=
Total Airport Count
+%133
Major Port Count
Oil Production (bbl/day)
Oil Reserves (bbl)
Coastline (km)
08Demographics
Total Population
+%143
Military Age Population
Urban Population (%)
Literacy Rate (%)
Area (km²)
📚 Sources
- Publicly available open sources and databases.