MACSI(Military Archive Country Strength Index)
ⓘ The ten scoring axes are weighted per country by coastal, nuclear, industrial, and geostrategic tier, then judged from real-world knowledge rather than stored database attributes — see methodology.
01 / Overview
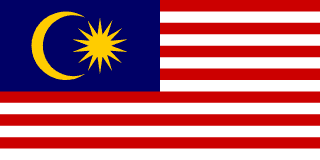
Malaysia
Government
Federal Republic
Population
34.31M
Area
330,803 km²
GDP (Nominal)
$406.0B
Active Personnel
110.0K
Reserve Personnel
50.0K
Defense Budget
$4.5B · %1.5 GDP
Conscription
None
9 years 11 months 24 days
TIME WITHOUT CONFLICT
02 / Military Strength · 76 metrics · 9 categories
30
MACSIMilitary Archive Country Strength Index
| # | Country | Overall | Land | Air | Naval | Leadership | Strategic | Industry | C4ISR | Logistics | Economy |
|---|---|---|---|---|---|---|---|---|---|---|---|
| #46 |  Belgium | 30 | 25 | 35 | 20 | 35 | 20 | 30 | 40 | 25 | 40 |
| #47 |  Jordan | 30 | 35 | 35 | 12 | 40 | 20 | 22 | 32 | 28 | 16 |
| #48 |  Malaysia | 30 | 32 | 32 | 32 | 35 | 12 | 25 | 28 | 30 | 30 |
| #49 |  Serbia | 29 | 35 | 30 | 5 | 30 | 10 | 45 | 25 | 30 | 28 |
| #50 |  Croatia | 28 | 25 | 30 | 20 | 45 | 10 | 20 | 40 | 30 | 30 |
Comparison countries are selected automatically based on global rankings.
Personnel Structure
Total Population: 34.3M
Active110K
Reserve50K
Paramilitary23K
Economic Burden
$4.5B 1.5% of GDP
0% 5%+
Per Capita $131/yr
Per Soldier $40,909/yr
Strategic Infrastructure
Military Airports 6
Total Airports 63
Major Ports 8
Coastline 4,675 km
Oil Production 550K bbl/day
All Military Metrics 75 metrics · 9 categories
01 Personnel 7
- Active Personnel 110,000
- Reserve Personnel 50,000
- Paramilitary Personnel 23,000
- Total Military Personnel 183,000
- Available for Military Service 10,000,000
- Reaching Military Age Annually 450,000
- Conscription Status None
02 Land Forces 12
- Total Tanks 46
- IFV Count 257
- APC Count 1,000
- Recon Vehicle Count 100
- MRAP Count 100
- Towed Artillery Count 300
- Self-Propelled Artillery Count 28
- MLRS Count 36
- Mortar Count 500
- ATGM Launcher Count 200
- SHORAD Count 0
- MANPADS Count 500
03 Air Forces 12
- Total Aircraft 110
- Fighter Aircraft Count 36
- Ground Attack Aircraft Count 8
- Bomber Aircraft Count 0
- Transport Aircraft Count 12
- Tanker Aircraft Count 4
- AWACS Count 4
- Trainer Aircraft Count 30
- Total Helicopters 60
- Attack Helicopter Count 12
- Transport Helicopter Count 20
- UAV Count 10
04 Naval Forces 11
- Total Ships 67
- Aircraft Carrier Count 0
- Amphibious Assault Ship Count 0
- Cruiser Count 0
- Destroyer Count 0
- Frigate Count 6
- Corvette Count 6
- Total Submarines 2
- SSN Count 0
- SSBN Count 0
- Patrol Boat Count 40
05 Strategic Forces 9
- Nuclear Status None
- Nuclear Warhead Count 0
- Deployed Warhead Count 0
- ICBM Count 0
- SLBM Count 0
- IRBM Count 0
- Triad Status None
- BMD Capability ✗ No
- Space Assets ✗ No
06 Budget & Economy 10
- Defense Budget (USD) 4,500,000,000 USD
- Defense Budget (% of GDP) 1.5 %
- Defense Budget per Capita (USD) 131 USD
- GDP (Nominal, USD) 406,000,000,000 USD
- GDP (PPP, USD) 950,000,000,000 USD
- Arms Exports (USD) 100,000,000 USD
- Arms Imports (USD) 1,500,000,000 USD
- Defense Industry Rank 25
- Defense Industry Size (USD) 1,500,000,000 USD
- Defense Sector Employment 20,000
07 Logistics & Infrastructure 6
- Military Airport Count 6
- Total Airport Count 63
- Major Port Count 8
- Oil Production (bbl/day) 550,000 bbl/day
- Oil Reserves (bbl) 3,000,000,000 bbl
- Coastline (km) 4,675 km
08 Demographics 5
- Total Population 34,308,525
- Military Age Population 12,000,000
- Urban Population (%) 78 %
- Literacy Rate (%) 95 %
- Area (km²) 330,803 km²
09 Government & Alliances 3
- Government Type Federal Republic
- NATO Member ✗ No
- UN Security Council P5 ✗ No
03 / Inventory · 422 systems · 84 categories · 45,113 units
Force Composition
Not yet entered. This chart will populate automatically once inventory data is added.
Status & Age Distribution
Status
Active 360 Retired 62
Age Profile
31years
average
%13
<10 yrs
Aging Fleet
1945–2023
Suppliers
Countries
-
 United States 103
-
 United Kingdom 56
-
 Germany 46
-
 Russia 38
-
 Italy 33
-
 France 28
-
 Switzerland 14
-
 Spain 10
Companies
Inventory 422 systems · 31 categories · 45,113 units
⌕
ARMOURED VEHICLES
Al-Khalid tank —
Tanks · ACTIVE
BMT-72 48
Tanks · ACTIVE
Bhishma tank —
Tanks · ACTIVE
FV101 Scorpion 26
Tanks · ACTIVE
IS —
Tanks · ACTIVE
PT-91 Twardy 48
Tanks · ACTIVE
Stingray light tank —
Tanks · ACTIVE
T-72 48
Tanks · ACTIVE
T-72 Scarab 48
Tanks · ACTIVE
T-72B3 48
Tanks · ACTIVE
T-72BA 48
Tanks · ACTIVE
T-72S 48
Tanks · ACTIVE
+26 more
ARTILLERY & MISSILE SYSTEMS
150 mm mortar —
Towed Artillery & Mortars · ACTIVE
155 mm FH-70 howitzer 15
Towed Artillery & Mortars · ACTIVE
2B14 Podnos —
Towed Artillery & Mortars · ACTIVE
Dragon Fire —
Towed Artillery & Mortars · ACTIVE
G5 howitzer 28
Towed Artillery & Mortars · ACTIVE
L16 81mm mortar —
Towed Artillery & Mortars · ACTIVE
LLR 81mm —
Towed Artillery & Mortars · ACTIVE
M102 40
Towed Artillery & Mortars · ACTIVE
M6 mortar —
Towed Artillery & Mortars · ACTIVE
Ordnance ML 4.2 inch Mortar —
Towed Artillery & Mortars · ACTIVE
9cm mortar —
Towed Artillery & Mortars · RETIRED
BL 5.5 inch gun —
Field Guns · ACTIVE
+8 more
AIR DEFENSE SYSTEMS
9K38 Igla —
MANPADS · ACTIVE
Anza —
MANPADS · ACTIVE
Blowpipe —
MANPADS · ACTIVE
Javelin —
MANPADS · ACTIVE
Starburst —
MANPADS · ACTIVE
Starstreak —
MANPADS · ACTIVE
Sea Cat —
SHORAD Systems · ACTIVE
Common Anti-Air Modular Missile —
Medium-Range SAM · ACTIVE
FN-6 —
Medium-Range SAM · ACTIVE
K-SAAM 48
Medium-Range SAM · ACTIVE
R-73 —
Medium-Range SAM · ACTIVE
Bofors 40 mm L/70 —
Anti-Aircraft Artillery (AAA) · ACTIVE
+7 more
MINES & EXPLOSIVE DEVICES
FIREARMS
Beretta 92 —
Pistols · ACTIVE
Beretta 92G-SD/96G-SD —
Pistols · ACTIVE
Beretta Px4 Storm 400
Pistols · ACTIVE
Browning Hi-Power —
Pistols · ACTIVE
CZ 75 —
Pistols · ACTIVE
CZ P-10 C —
Pistols · ACTIVE
Carbon 15 —
Pistols · ACTIVE
Colt 1991 —
Pistols · ACTIVE
Colt Pistol Model 1927 —
Pistols · ACTIVE
Coonan .357 Magnum —
Pistols · ACTIVE
Glock —
Pistols · ACTIVE
Grand Power K100 —
Pistols · ACTIVE
+141 more
GRENADE LAUNCHERS & GRENADES
M203 —
Underbarrel Grenade Launchers · ACTIVE
M320 Grenade Launcher Module —
Underbarrel Grenade Launchers · ACTIVE
Brügger & Thomet GL-06 —
Standalone Grenade Launchers · ACTIVE
C90-CR 958
Standalone Grenade Launchers · ACTIVE
Heckler & Koch GMG —
Standalone Grenade Launchers · ACTIVE
Heckler & Koch HK69A1 —
Standalone Grenade Launchers · ACTIVE
M79 grenade launcher —
Standalone Grenade Launchers · ACTIVE
Milkor 40mm UBGL grenade launcher —
Standalone Grenade Launchers · ACTIVE
Milkor MGL —
Standalone Grenade Launchers · ACTIVE
PIAT —
Standalone Grenade Launchers · ACTIVE
SIG GL 5040 —
Standalone Grenade Launchers · ACTIVE
NGOS —
Hand Grenades · ACTIVE
+9 more
OPTICS & TARGETING
PERSONAL PROTECTIVE EQUIPMENT
MILITARY VEHICLES
FIGHTER & ATTACK AIRCRAFT
CAC Sabre 18
Air Superiority Fighters · ACTIVE
Northrop F-5 —
Air Superiority Fighters · ACTIVE
Northrop F-5 Tiger II 20
Air Superiority Fighters · RETIRED
MD 500 Defender —
Multirole Fighters · ACTIVE
McDonnell Douglas F/A-18 Hornet —
Multirole Fighters · ACTIVE
Mikoyan MiG-29 —
Multirole Fighters · ACTIVE
Su-30MKM 18
Multirole Fighters · ACTIVE
Sukhoi Su-30 18
Multirole Fighters · ACTIVE
Douglas A-4 Skyhawk 88
Ground Attack / CAS Aircraft · ACTIVE
Douglas NA-4 Skyhawk 88
Ground Attack / CAS Aircraft · RETIRED
Douglas TA-4 Skyhawk 88
Ground Attack / CAS Aircraft · RETIRED
Douglas XA4D-1 Skyhawk 88
Ground Attack / CAS Aircraft · RETIRED
BOMBER AIRCRAFT
TRANSPORT & CARGO AIRCRAFT
Airbus A400M Atlas —
Strategic Airlifters · ACTIVE
C-130A Hercules —
Tactical Transports · ACTIVE
C-130E Hercules —
Tactical Transports · ACTIVE
De Havilland Canada DHC-4 Caribou —
Tactical Transports · ACTIVE
Lockheed C-130 Hercules —
Tactical Transports · ACTIVE
Lockheed C-130H Hercules —
Tactical Transports · ACTIVE
Lockheed KC-130 Hercules 4
Tactical Transports · ACTIVE
Lockheed KC-130F Hercules 4
Tactical Transports · ACTIVE
Lockheed KC-130H Hercules —
Tactical Transports · ACTIVE
Scottish Aviation Twin Pioneer 15
Tactical Transports · ACTIVE
C-12A Huron —
Tactical Transports · RETIRED
CASA/IPTN CN-235 —
Light / Medium Transports · ACTIVE
HELICOPTERS
AS355 Écureuil 2 —
Utility / Transport Helicopters · ACTIVE
AgustaWestland AW109 —
Utility / Transport Helicopters · ACTIVE
AgustaWestland AW109S Grand —
Utility / Transport Helicopters · ACTIVE
AgustaWestland AW119 Koala —
Utility / Transport Helicopters · ACTIVE
AgustaWestland AW149 18
Utility / Transport Helicopters · ACTIVE
AgustaWestland AW189 2
Utility / Transport Helicopters · ACTIVE
Airbus Helicopters H145 —
Utility / Transport Helicopters · ACTIVE
Bell H-13 Sioux —
Utility / Transport Helicopters · ACTIVE
Dauphin 2 —
Utility / Transport Helicopters · ACTIVE
FH-1100 —
Utility / Transport Helicopters · ACTIVE
Fennec —
Utility / Transport Helicopters · ACTIVE
H-60 —
Utility / Transport Helicopters · ACTIVE
+13 more
UAV / DRONES
June 30 —
Combat / Strike Drones · ACTIVE
Black Hornet Nano —
Reconnaissance / Surveillance Drones · ACTIVE
Boeing Insitu MQ-27 ScanEagle —
Reconnaissance / Surveillance Drones · ACTIVE
DJI Matrice series —
Reconnaissance / Surveillance Drones · ACTIVE
DJI Mavic Mini —
Reconnaissance / Surveillance Drones · ACTIVE
NCSIST Albatross —
Reconnaissance / Surveillance Drones · ACTIVE
Primoco UAV 7
Reconnaissance / Surveillance Drones · ACTIVE
TAI Anka 3
Reconnaissance / Surveillance Drones · ACTIVE
WB Electronics FlyEye —
Reconnaissance / Surveillance Drones · ACTIVE
Tiptchak —
Reconnaissance / Surveillance Drones · RETIRED
SPECIAL MISSION AIRCRAFT
TRAINING AIRCRAFT
SURFACE COMBATANTS
Weapon-class destroyer —
Destroyers · ACTIVE
FS 1500-class frigate —
Frigates · ACTIVE
Lekiu-class frigate —
Frigates · ACTIVE
Loch-class frigate —
Frigates · ACTIVE
Type 65 frigate —
Frigates · ACTIVE
armored frigate —
Frigates · RETIRED
Assad-class corvette —
Corvettes · ACTIVE
Fincantieri-class corvette —
Corvettes · ACTIVE
Kasturi-class corvette —
Corvettes · ACTIVE
Laksamana-class corvette 2
Corvettes · ACTIVE
Sigma-class corvette —
Corvettes · ACTIVE
Kil-class sloop —
Corvettes · RETIRED
+1 more
SUBMARINES
AMPHIBIOUS WARFARE SHIPS
C-139 tank landing ship 1
Landing Ship Tank (LST) · RETIRED
LST Mk. 1-class tank landing ship —
Landing Ship Tank (LST) · RETIRED
LST Mk. 2-class tank-landing ship —
Landing Ship Tank (LST) · RETIRED
LST Mk. 3-class tank landing ship —
Landing Ship Tank (LST) · RETIRED
Newport-class tank landing ship —
Landing Ship Tank (LST) · RETIRED
Jurmo-class landing craft 10
Landing Craft (LCAC, LCM) · ACTIVE
Mark 8 Landing Craft Tank —
Landing Craft (LCAC, LCM) · ACTIVE
Watercat M14-class landing craft 10
Landing Craft (LCAC, LCM) · ACTIVE
MINE WARFARE & PATROL
Ham-class inshore minesweeper —
Mine Countermeasures Vessels (MCM) · ACTIVE
Lerici-class minehunter —
Mine Countermeasures Vessels (MCM) · ACTIVE
Ton-class minesweeper —
Mine Countermeasures Vessels (MCM) · ACTIVE
modified Ton-class minesweeper —
Mine Countermeasures Vessels (MCM) · RETIRED
Hatsutaka-class minelayer —
Mine Layers · RETIRED
CB90-class fast assault craft 17
Patrol Boats & Fast Attack Craft · ACTIVE
CB90N-class fast assault craft 17
Patrol Boats & Fast Attack Craft · ACTIVE
DOM Handalan-class missile boat —
Patrol Boats & Fast Attack Craft · ACTIVE
Heron-class river gunboat —
Patrol Boats & Fast Attack Craft · ACTIVE
Perdana-class missile boat 6
Patrol Boats & Fast Attack Craft · ACTIVE
Gleaner-class gunboat —
Patrol Boats & Fast Attack Craft · RETIRED
La Combattante III type fast attack craft —
Patrol Boats & Fast Attack Craft · RETIRED
+5 more
NAVAL WEAPON SYSTEMS
A244-S torpedo 75
Torpedoes · ACTIVE
Black Shark torpedo 30
Torpedoes · ACTIVE
limpet mine —
Naval Mines · ACTIVE
30 mm Breda-Mauser 6
Naval Guns · ACTIVE
Bofors 57 mm Mk.1 gun —
Naval Guns · ACTIVE
French 100 mm naval gun —
Naval Guns · ACTIVE
OTO Melara 76 mm gun —
Naval Guns · ACTIVE
DARDO —
Ship-based CIWS · ACTIVE
Phalanx CIWS Km1992//0.33149874000/0482492-2 —
Ship-based CIWS · ACTIVE
ATGM
9K115 Metis —
Anti-Tank Guided Missiles (ATGM) · ACTIVE
9K115-2 Metis-M 100
Anti-Tank Guided Missiles (ATGM) · ACTIVE
ERYX NaN
Anti-Tank Guided Missiles (ATGM) · ACTIVE
HJ-8 450
Anti-Tank Guided Missiles (ATGM) · ACTIVE
Ingwe 216
Anti-Tank Guided Missiles (ATGM) · ACTIVE
MBT LAW 500
Anti-Tank Guided Missiles (ATGM) · ACTIVE
Nord SS.11 —
Anti-Tank Guided Missiles (ATGM) · ACTIVE
Mosquito —
Anti-Tank Guided Missiles (ATGM) · RETIRED
ANTI-SHIP MISSILES
Atmaca —
Ship-Launched Anti-Ship Missiles · ACTIVE
C-802 —
Ship-Launched Anti-Ship Missiles · ACTIVE
Exocet —
Ship-Launched Anti-Ship Missiles · ACTIVE
Harpoon —
Ship-Launched Anti-Ship Missiles · ACTIVE
Kh-35 —
Ship-Launched Anti-Ship Missiles · ACTIVE
Kh-59 Ovod —
Ship-Launched Anti-Ship Missiles · ACTIVE
Sea Skua —
Ship-Launched Anti-Ship Missiles · ACTIVE
Otomat —
Ship-Launched Anti-Ship Missiles · RETIRED
AIR-TO-AIR MISSILES
AIM-9 Sidewinder —
Short-Range AAM (SRAAM / WVR) · ACTIVE
AIM-9M Sidewinder —
Short-Range AAM (SRAAM / WVR) · ACTIVE
R-60 —
Short-Range AAM (SRAAM / WVR) · ACTIVE
AIM-120 AMRAAM —
Medium-Range AAM (MRAAM / BVR) · ACTIVE
AIM-7 Sparrow —
Medium-Range AAM (MRAAM / BVR) · ACTIVE
MICA —
Medium-Range AAM (MRAAM / BVR) · ACTIVE
R-27 —
Medium-Range AAM (MRAAM / BVR) · ACTIVE
R-77 150
Medium-Range AAM (MRAAM / BVR) · ACTIVE
AIM-7D Sparrow III —
Medium-Range AAM (MRAAM / BVR) · RETIRED
AIR-TO-SURFACE MISSILES
CRUISE MISSILES
GUIDED BOMBS
UNGUIDED AERIAL MUNITIONS
RADAR SYSTEMS
LAUNCH VEHICLES
RECENT ACQUISITIONS & MODERNIZATION NEED
LAST 5 ACQUISITIONS
SYSTEMS 20+ YEARS IN SERVICE
04 / Defense Sector · 7 companies · 7 systems produced · 35 deals
Full Companies List7 defense companies→All Produced Weapons List7 weapon systems→All Defense Deals35 defense deals→
DEFENSE TRADE BALANCE annual estimate · from DB
Defense Industry Size
$1.5 Mr
annual output value
Sector Employment
20 K
total employees
↗ EXPORTS
$100 M
↘ IMPORTS
$1.5 Mr
⚖ NET BALANCE
$-1.4 Mr
NET IMPORTER
In exports
In imports
Export per Capita $2.9 per citizen
Import per Capita $43.7 per citizen
OWNERSHIP STRUCTURE & SECTOR STARS
OWNERSHIP DISTRIBUTION
Private-Closed2
SECTOR STARS
WIDEST PORTFOLIO
🎯 Boustead Heavy Industries Corporation Berhad SECTOR HERITAGE
PRODUCTION PROFILE
7
Total Systems
7
Ongoing
0
Ended
59
Avg. MASS Score
ALL COMPANIES 7 companies · 7 active
Sort:
| Company | Revenue | Systems | Score |
|---|---|---|---|
| Boustead Heavy Industries Corporation Berhad | — | 2 | — |
| Composites Technology Research Malaysia | — | 1 | — |
| Malaysian Marine and Heavy Engineering | — | 1 | — |
| Mildef International Technologies | — | 1 | — |
| PSC-Naval Dockyard | — | 1 | — |
| Q64371300 | — | 1 | — |
| SME Ordnance | — | 1 | — |
Production 7 systems · 5 categories
Show:
⌕
ARMOURED VEHICLES
SURFACE COMBATANTS
MINE WARFARE & PATROL
NAVAL WEAPON SYSTEMS
RECENT DEFENSE DEALS1 export · 34 import
| Direction | Year | Counterparty | Product / Service | Quantity | Amount | Type | Status | |
|---|---|---|---|---|---|---|---|---|
| ↘ | 2025 | Italy | AgustaWestland AW149 | 18 | — | new-build | ordered | |
| ↘ | 2024 |  South Korea | K-SAAM | 48 | — | new-build | ordered | |
| ↘ | 2024 | Italy | AgustaWestland AW189 | 4 | — | new-build | ordered | |
| ↘ | 2024 |  Slovakia | 155 mm SpGH EVA | — | — | new-build | Cancelled | |
| ↘ | 2023 | France | Ground Master 200 | 1 | — | new-build | ordered | |
| ↘ | 2016 | Italy | AgustaWestland AW189 | 2 | — | new-build | Delivered | |
| ↘ | 2013 | United States | Colt CM901 | 200 | — | export | confirmed | |
| ↘ | 2013 | Italy | AgustaWestland AW189 | 2 | — | new-build | ordered | |
| ↘ | 2007 | Germany | SIG Sauer Pro series | 2,000 | — | new-build | Delivered | |
| ↘ | 2005 |  People's Republic of China | HQ-12 | — | — | new-build | ordered | |
| ↘ | 2004 | People's Republic of China | FN-6 | — | — | license-production | Delivered | |
| ↘ | 2003 | Italy | Black Shark torpedo | 30 | — | new-build | Delivered | |
| ↘ | 2003→2009 | Russia | Su-30MKM | 18 | $900 M | new-build | Delivered | |
| ↘ | 2002→2009 | France | Scorpène-class submarine | 2 | $1.0 Mr | new-build | Delivered | |
| ↘ | 1998→2006 |  Poland | PT-91 Twardy | 48 | $250 M | new-build | Delivered | |
| ↘ | 1997→1999 | Italy | Laksamana-class corvette | 2 | — | new-build | Delivered | |
| ↘ | 1995→1997 | Italy | Laksamana-class corvette | 4 | — | new-build | Delivered | |
| ↘ | 1981→1985 | Italy | Lerici-class minehunter | 4 | — | new-build | Delivered | |
| ↘ | 1981→1984 | Germany | Condor | 460 | — | new-build | Delivered | |
| ↘ | 1964 | United Kingdom | Loch-class frigate | 1 | — | second-hand | Delivered | |
| ↘ | 1962→1964 | United Kingdom | Ferret | 92 | — | new-build | Delivered | |
| ↘ | — |  Brazil | Astros II | 36 | — | new-build | Delivered | |
| ↘ | — | United States | M40 rifle | — | — | aid | Delivered | |
| ↘ | — |  Turkey | Nurol Ejder | 20 | — | new-build | Delivered | |
| ↘ | — | United States | Colt Advanced Piston Carbine | — | — | new-build | Delivered | |
| ↘ | — | United States | XM8 rifle | — | — | new-build | Delivered | |
| ↘ | — |  South Africa | G5 howitzer | 28 | — | new-build | Delivered | |
| ↘ | — | Poland | WB Electronics FlyEye | — | — | new-build | Delivered | |
| ↘ | — |  Czech Republic | Primoco UAV | 7 | — | aid | Delivered | |
| ↘ | — | France | Agosta-class submarine | 1 | — | second-hand | Delivered | |
| ↘ | — | Czech Republic | CZ P-10 C | — | — | new-build | Delivered | |
| ↘ | — | Italy | Beretta Px4 Storm | 400 | — | new-build | Delivered | |
| ↗ | — |  Indonesia | CAC Sabre | 5 | — | gift | Delivered | |
| ↘ | — |  Australia | CAC Sabre | 18 | — | second-hand | Delivered | |
| ↘ | — | Poland | BMT-72 | 48 | — | new-build | Delivered |
1 / 4
ALL-TIME ARMS TRADE35transactions · inflation-adjusted
↗ EXPORTS
—
1transactions
↘ IMPORTS
$3.9 Mr
34transactions
Σ TOTAL
$3.9 Mr
35transactions
Sum of all defense deals in our database, adjusted to 2025 prices (CPI). Exports (→) are what this country sold, imports (←) what it bought. Covers only transactions recorded in our archive; the real historical total is higher.
MOST POPULAR PRODUCTSused by 11 countries
- #1First Win7countryArmoured Personnel Carriers (APC)
- #2Malinnov pistol2countryPistols
- #3lela2countryNaval Guns
- #4Maharaja Lela-class frigate1countryLittoral / Coastal Combat Ships
- #5Tun Fatimah-class offshore patrol vessel1countryOffshore Patrol Vessels (OPV)
- #6VB Berapi LP061countryAssault Rifles
- #7Handalan-class missile boat1countryPatrol Boats & Fast Attack Craft
05 / History & Conflicts · 4 armed events
Fire Line Most active: Cold War
Alliance Network by past conflicts
🛡 Most Allied
United Kingdom 9 wars Australia 8 wars New Zealand 7 wars Pakistan 6 wars United States 6 wars ◄── Malaysia ──►
Based on conflicts fought on the same or opposing side.
War Statistics Malaysia · 13 conflicts
13Conflicts
1Wins
0Losses
0Draws
0Ongoing
Highest Own Losses 13 Battle of Long Jawai Highest Enemy Losses 104 Landing at Pontian Longest 21 years Communist insurgency in Malaysia
Human Cost · Malaysia
4Military
0Civilian
0Displaced
Data as of 2026; figures may vary by source.
📜 Chronological Conflict List
| Conflict | Years | Opponent | Role | Outcome |
|---|---|---|---|---|
| Operation Ocean Shield Special Op. | 2009–2016 | Somali pirates | Primary | — |
| Operation Astute Special Op. | 2006–present | Renegade elements of the FDTL | Primary | — |
| Operation Enduring Freedom Special Op. | 2001–2014 | Intervention | Primary | — |
| United Nations Operation in Somalia II Special Op. | 1993–1995 | Intervention | Primary | — |
| Operation Gothic Serpent Special Op. | 1993 | {{plainlist| Somali National Alliance }} | Primary | — |
| Unified Task Force Special Op. | 1992–1993 | Somali National Alliance Al-Itihaad al-Islamiya | Primary | — |
| Third Indochina War Interstate | 1975–1991 | (until 1989) (from 1989) Arms supplies | Primary | — |
| Communist insurgency in Malaysia Insurgency | 1968–1989 | Intervention | Primary | — |
| Battle of Sungei Koemba Interstate | 1965 | Intervention | Primary | Decisive Win |
| Landing at Pontian Intervention | 1964–present | Intervention | Primary | Decisive Win |
| Landing at Kesang River Interstate | 1964–present | Intervention | Primary | Decisive Win |
| Landing at Labis Interstate | 1964 | Intervention | Primary | Decisive Win |
| Battle of Long Jawai Interstate | 1963–present | Intervention | Primary | Decisive Win |
1 / 2
06 / Geostrategy · comparative
A
VSB
MalaysiavsBelgium
01Personnel
Active Personnel
+%323
Reserve Personnel
+%400
Paramilitary Personnel
+%100
Total Military Personnel
+%408
Available for Military Service
+%233
Reaching Military Age Annually
+%275
Conscription Duration (days)
02Land Forces
Total Tanks
+%100
IFV Count
+%14
APC Count
+%150
Recon Vehicle Count
+%50
MRAP Count
+%100
Towed Artillery Count
+%200
Self-Propelled Artillery Count
+%17
MLRS Count
+%100
Mortar Count
+%67
ATGM Launcher Count
+%150
SHORAD Count
=
MANPADS Count
=
03Air Forces
Total Aircraft
+%53
Fighter Aircraft Count
+%50
Ground Attack Aircraft Count
+%100
Bomber Aircraft Count
=
Transport Aircraft Count
=
Tanker Aircraft Count
+%100
AWACS Count
+%300
Trainer Aircraft Count
+%67
Total Helicopters
+%100
Attack Helicopter Count
+%20
Transport Helicopter Count
=
UAV Count
+%100
04Naval Forces
Total Ships
×33.5
Aircraft Carrier Count
=
Amphibious Assault Ship Count
=
Cruiser Count
=
Destroyer Count
=
Frigate Count
+%200
Corvette Count
+%100
Total Submarines
+%100
SSN Count
=
SSBN Count
=
Patrol Boat Count
×20.0
05Strategic Forces
Nuclear Warhead Count
=
Deployed Warhead Count
=
ICBM Count
=
SLBM Count
=
IRBM Count
=
06Budget & Economy
Defense Budget (USD)
+%33
Defense Budget (% of GDP)
+%36
Defense Budget per Capita (USD)
+%289
GDP (Nominal, USD)
+%58
GDP (PPP, USD)
+%32
Arms Exports (USD)
+%900
Arms Imports (USD)
=
Defense Industry Rank
+%25
Defense Industry Size (USD)
+%67
Defense Sector Employment
+%33
07Logistics & Infrastructure
Military Airport Count
=
Total Airport Count
+%50
Major Port Count
+%300
Oil Production (bbl/day)
×55.0
Oil Reserves (bbl)
+%100
Coastline (km)
×70.8
08Demographics
Total Population
+%192
Military Age Population
+%155
Urban Population (%)
+%26
Literacy Rate (%)
+%4
Area (km²)
+%984
📚 Sources
- Publicly available open sources and databases.